01 / Summarize
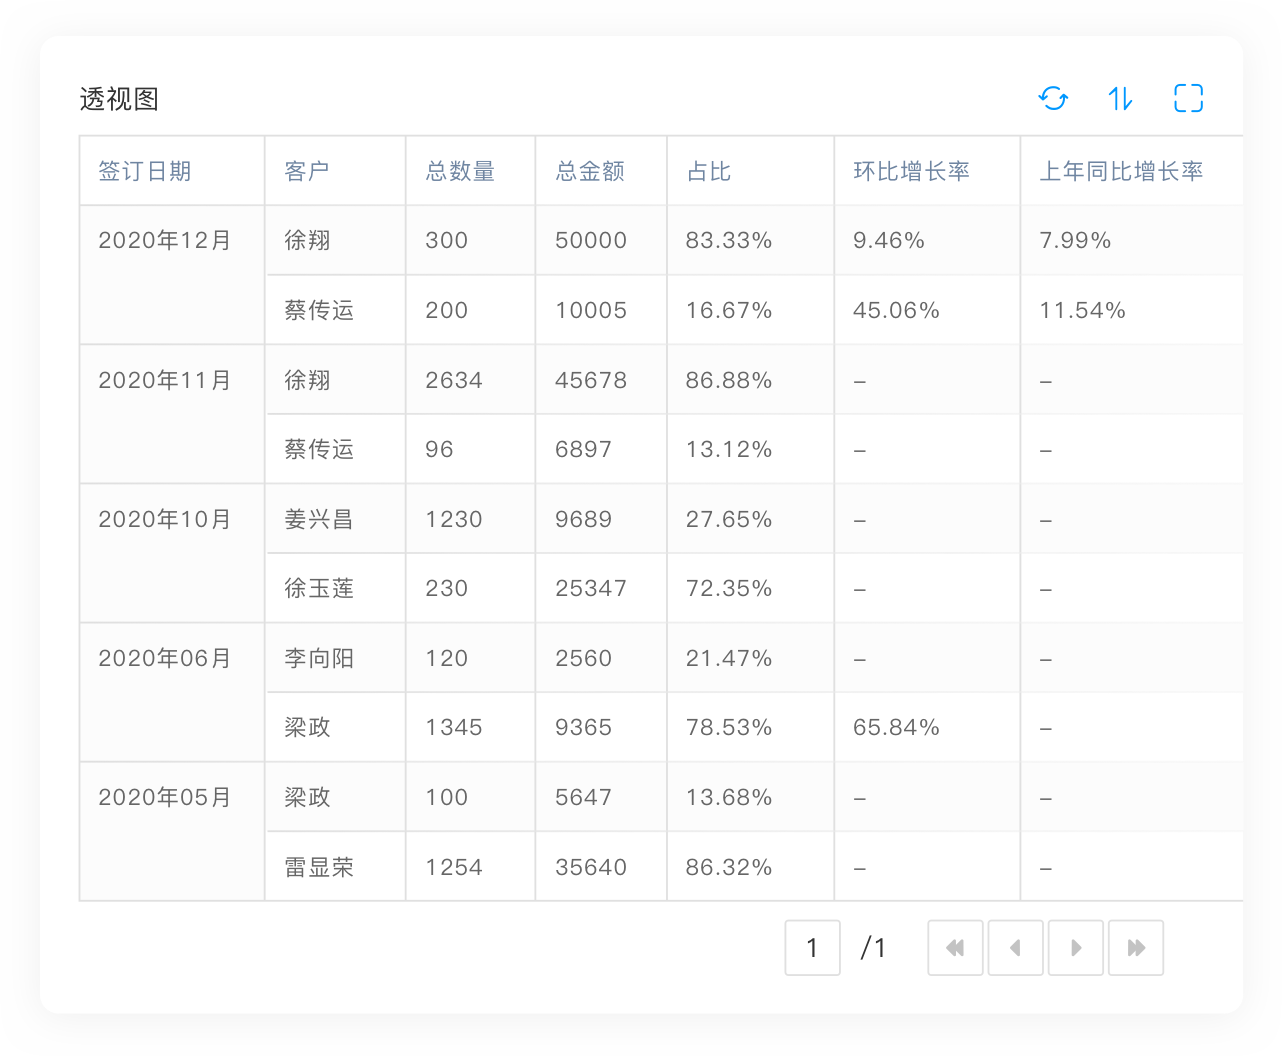
Pivot Views
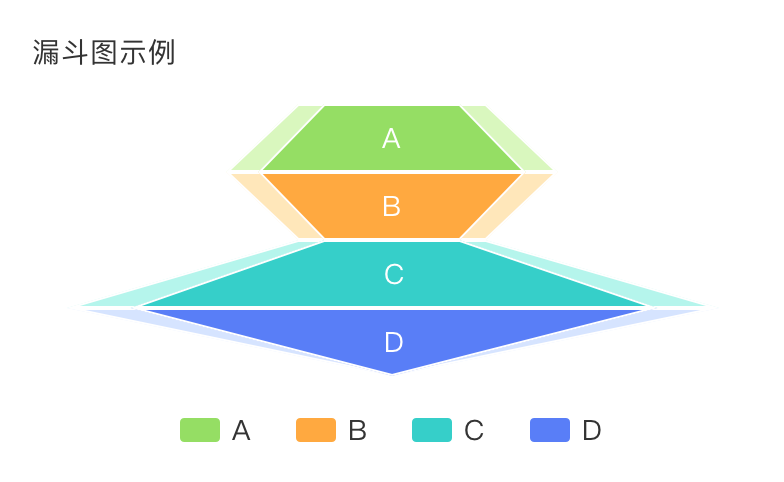
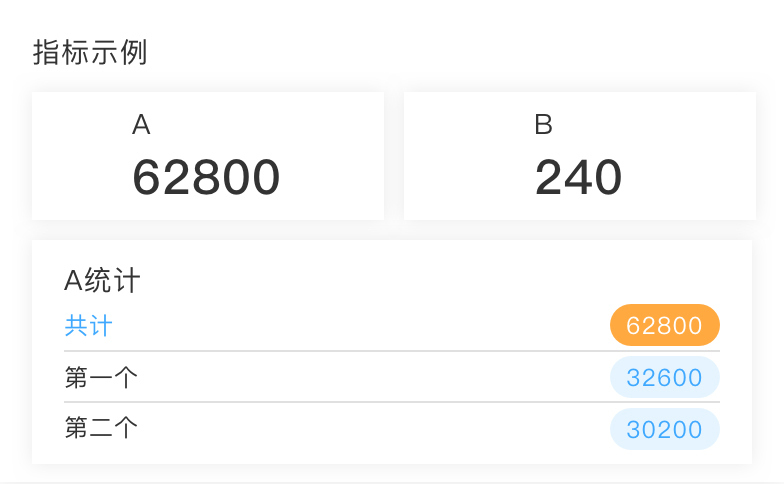
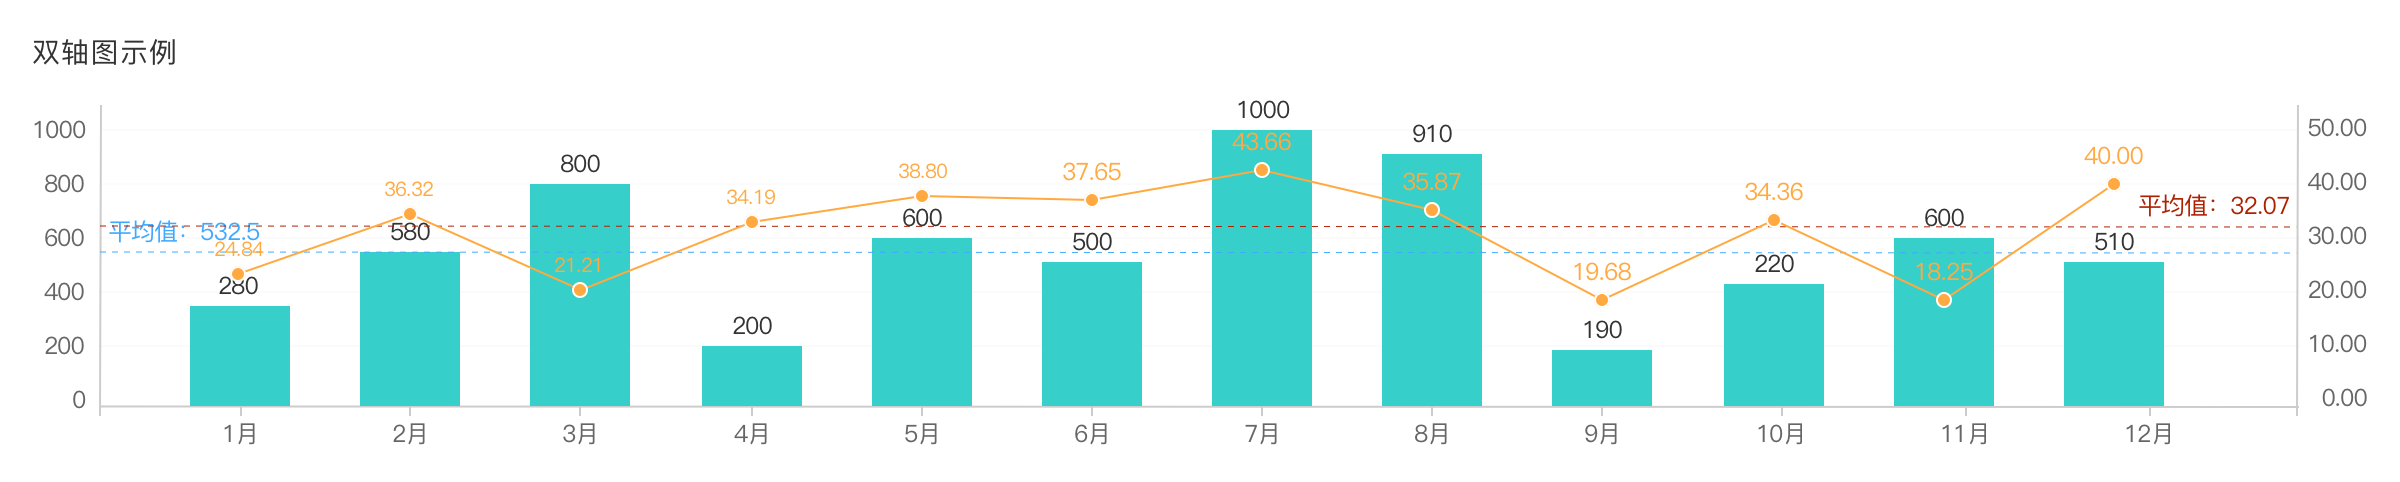
Classify and aggregate data to calculate statistics, proportions, period-over-period changes, and year-over-year comparisons.
Get Started →
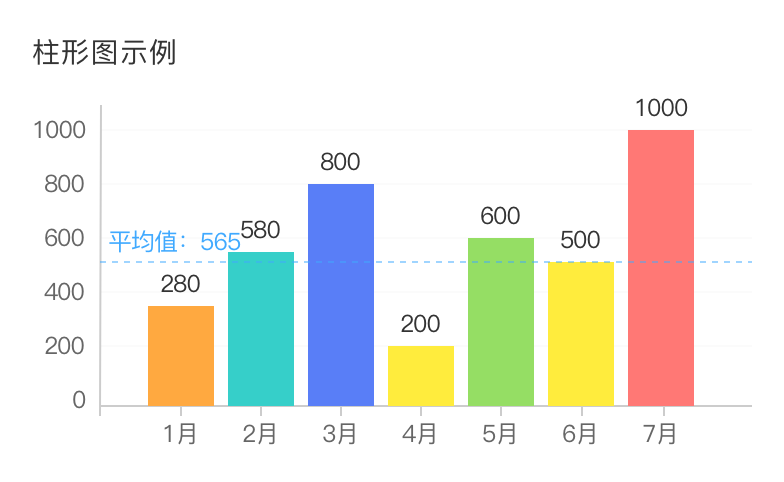
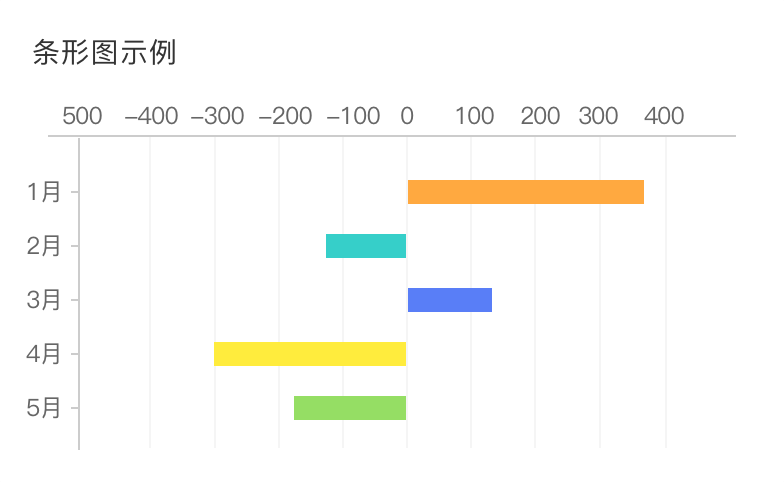
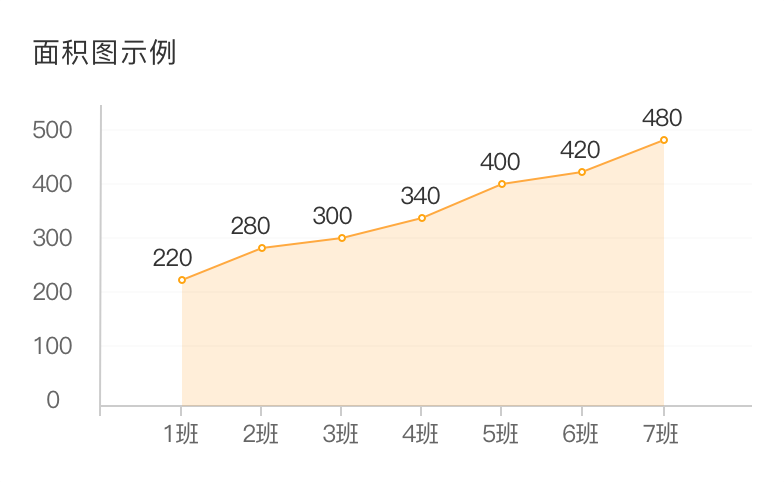
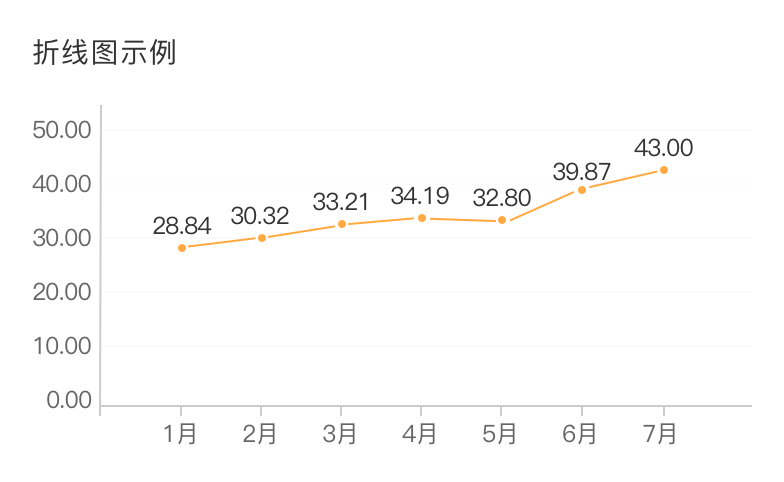
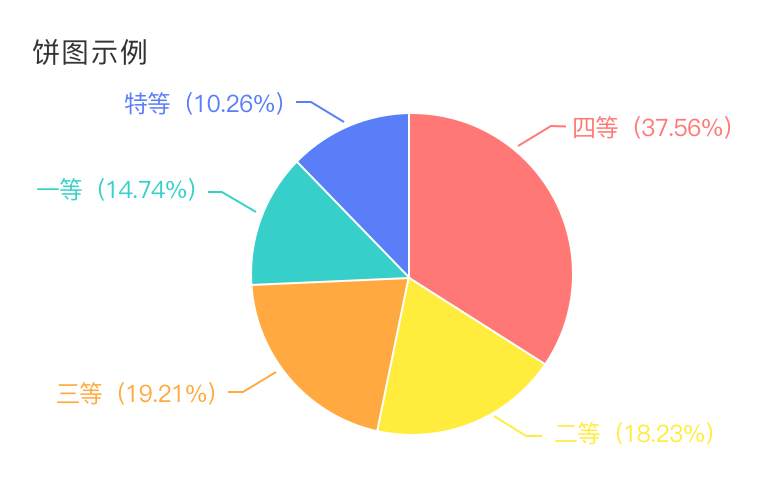
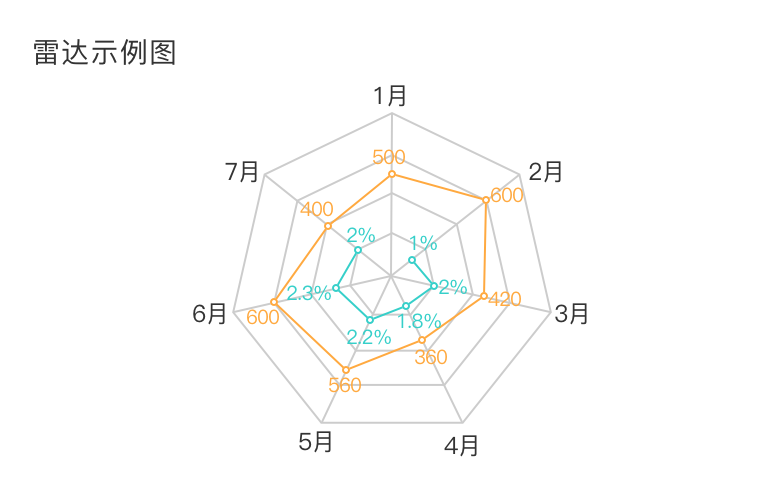
Turn enterprise data into clear visual stories and give decision-makers multidimensional insight they can act on.
Get StartedRich visualization
Every strong business decision starts with accurate analysis.
01 / Summarize
Classify and aggregate data to calculate statistics, proportions, period-over-period changes, and year-over-year comparisons.
Get Started →
02 / Organize
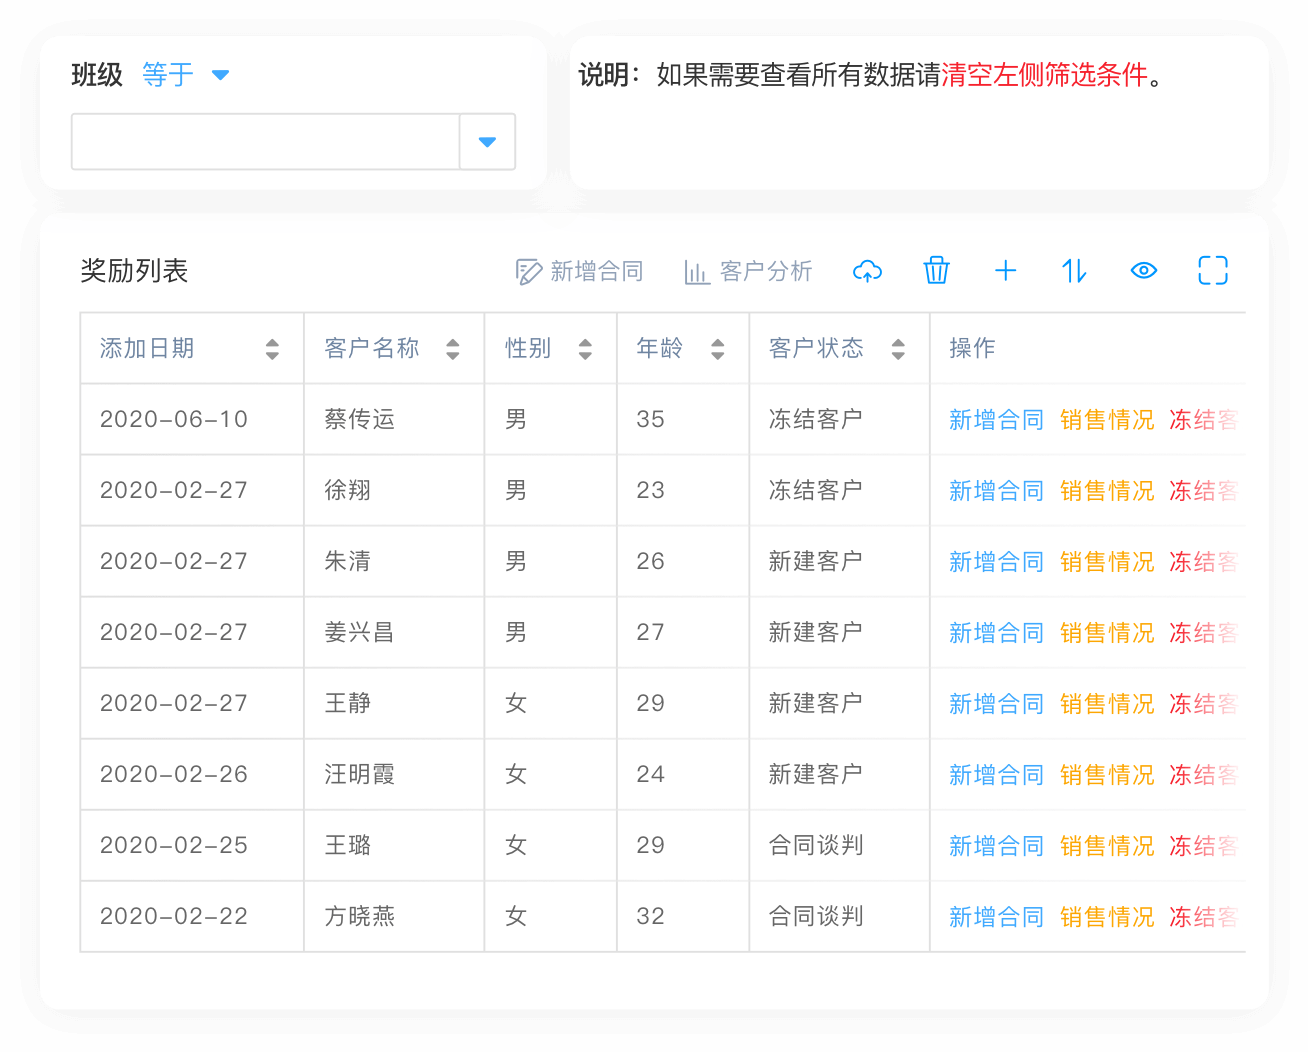
Display and manage business data in familiar, structured table layouts.
Get Started →03 / Locate
Display and manage data by geographic location, with built-in navigation support.
Get Started →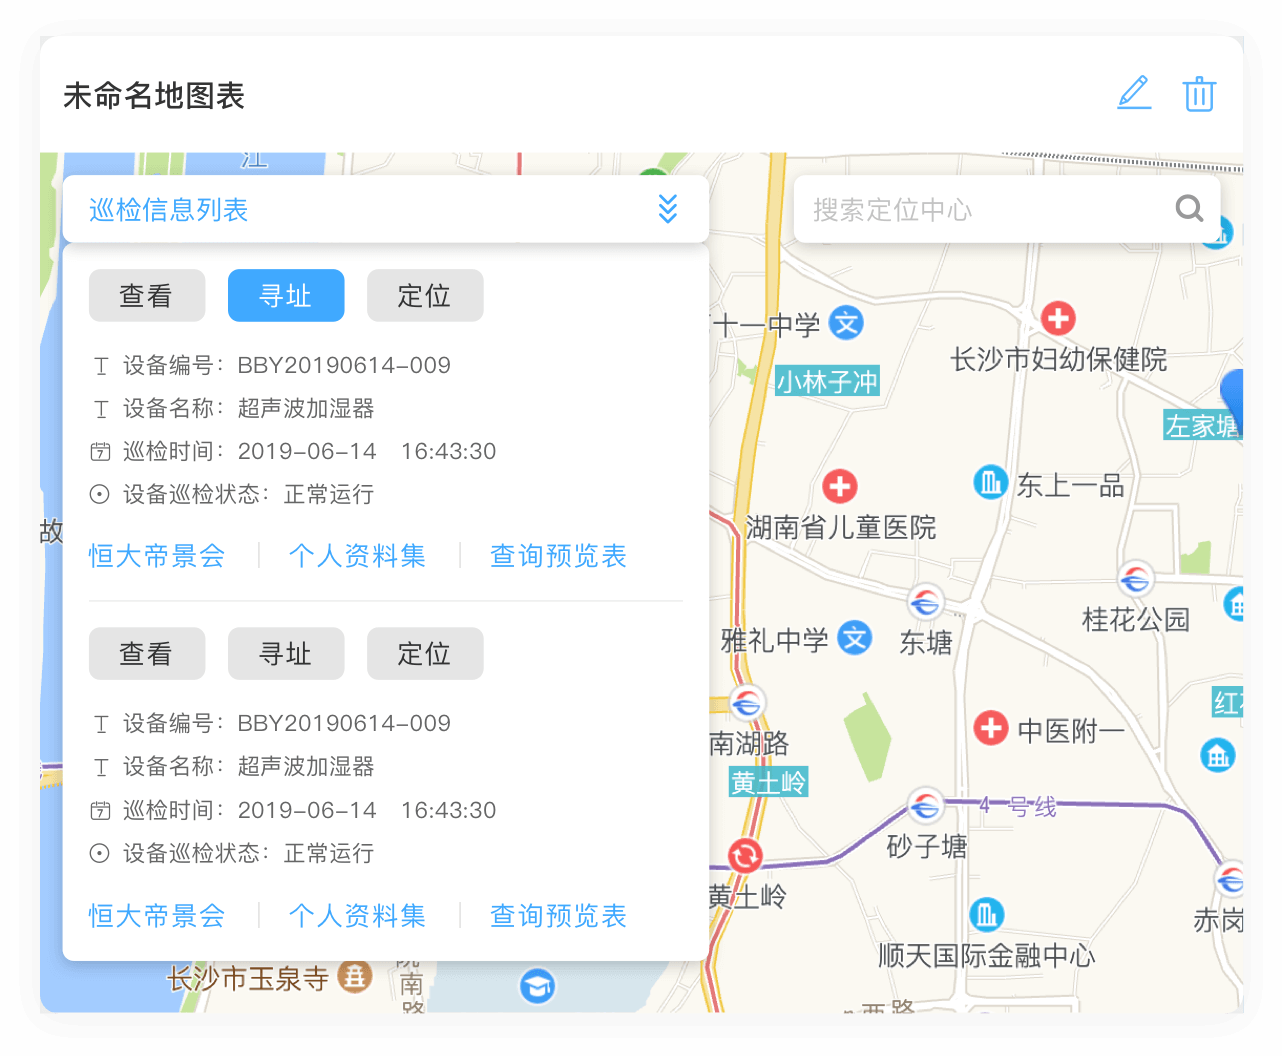

04 / Focus
Present and manage key data around people, customers, assets, or other business objects.
Get Started →05 / Protect
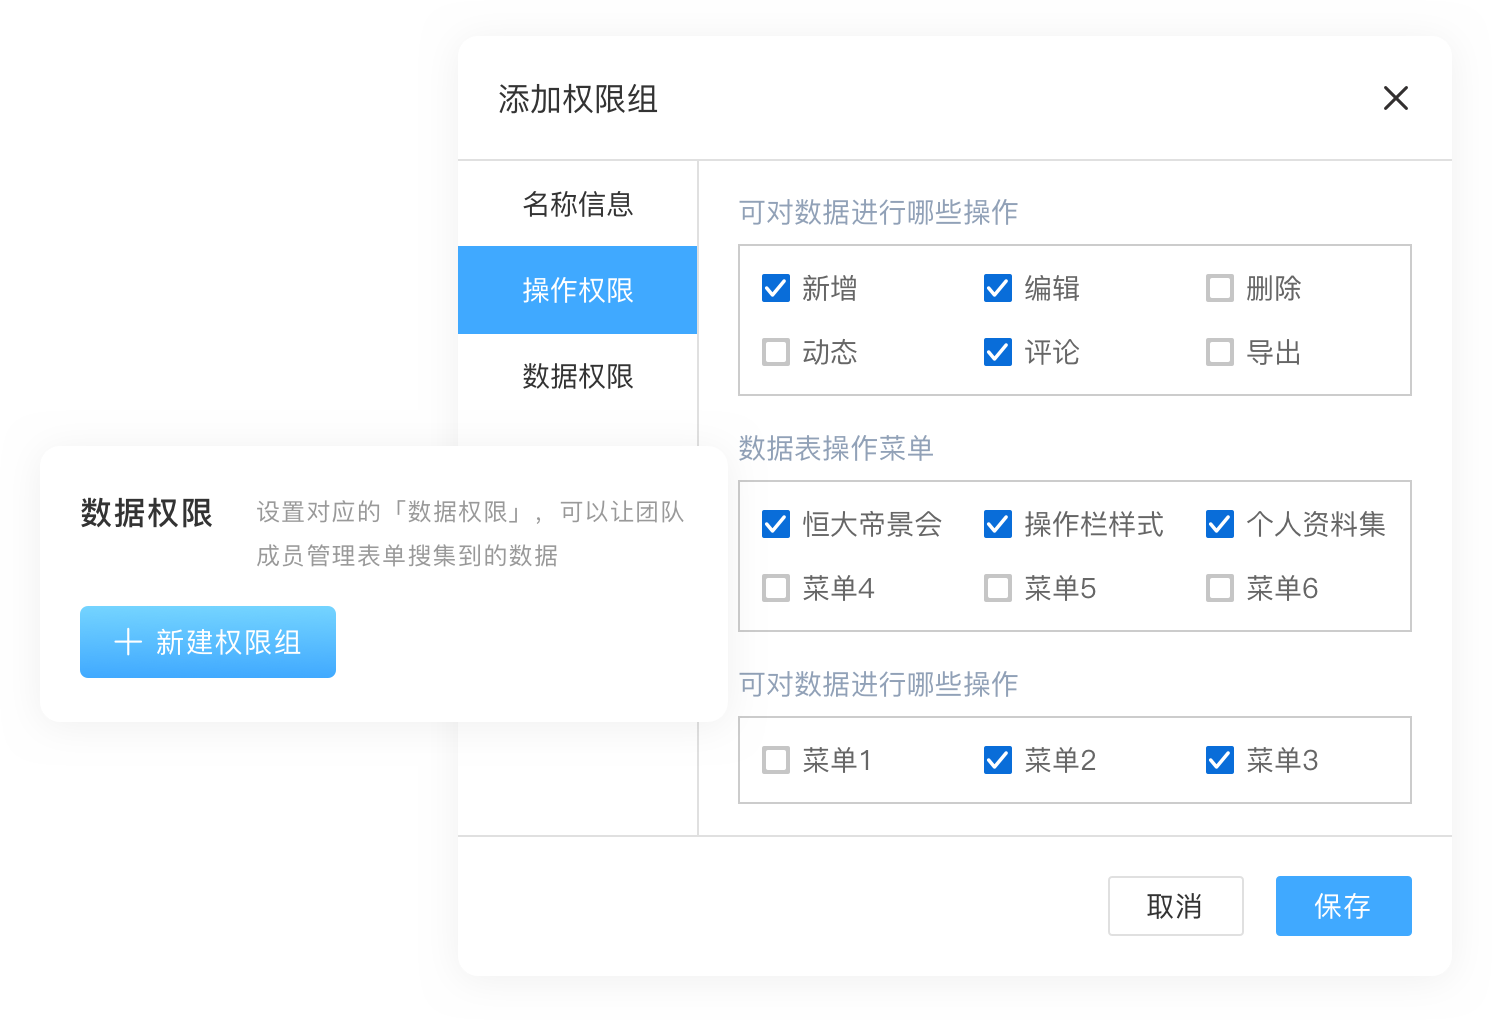
Control how each team member can view and operate on data, keeping sensitive information secure.
Get Started →