01 / Build
Data Views
Perform multi-table calculations in a single step by dragging nodes and drawing connections.
Get Started →
Connect, aggregate, calculate, and analyze data across multiple tables. Build sophisticated data-processing flows through a visual drag-and-drop interface.
Get StartedA visual data pipeline
Build each step visually, from joining sources to preparing the final result.
01 / Build
Perform multi-table calculations in a single step by dragging nodes and drawing connections.
Get Started →
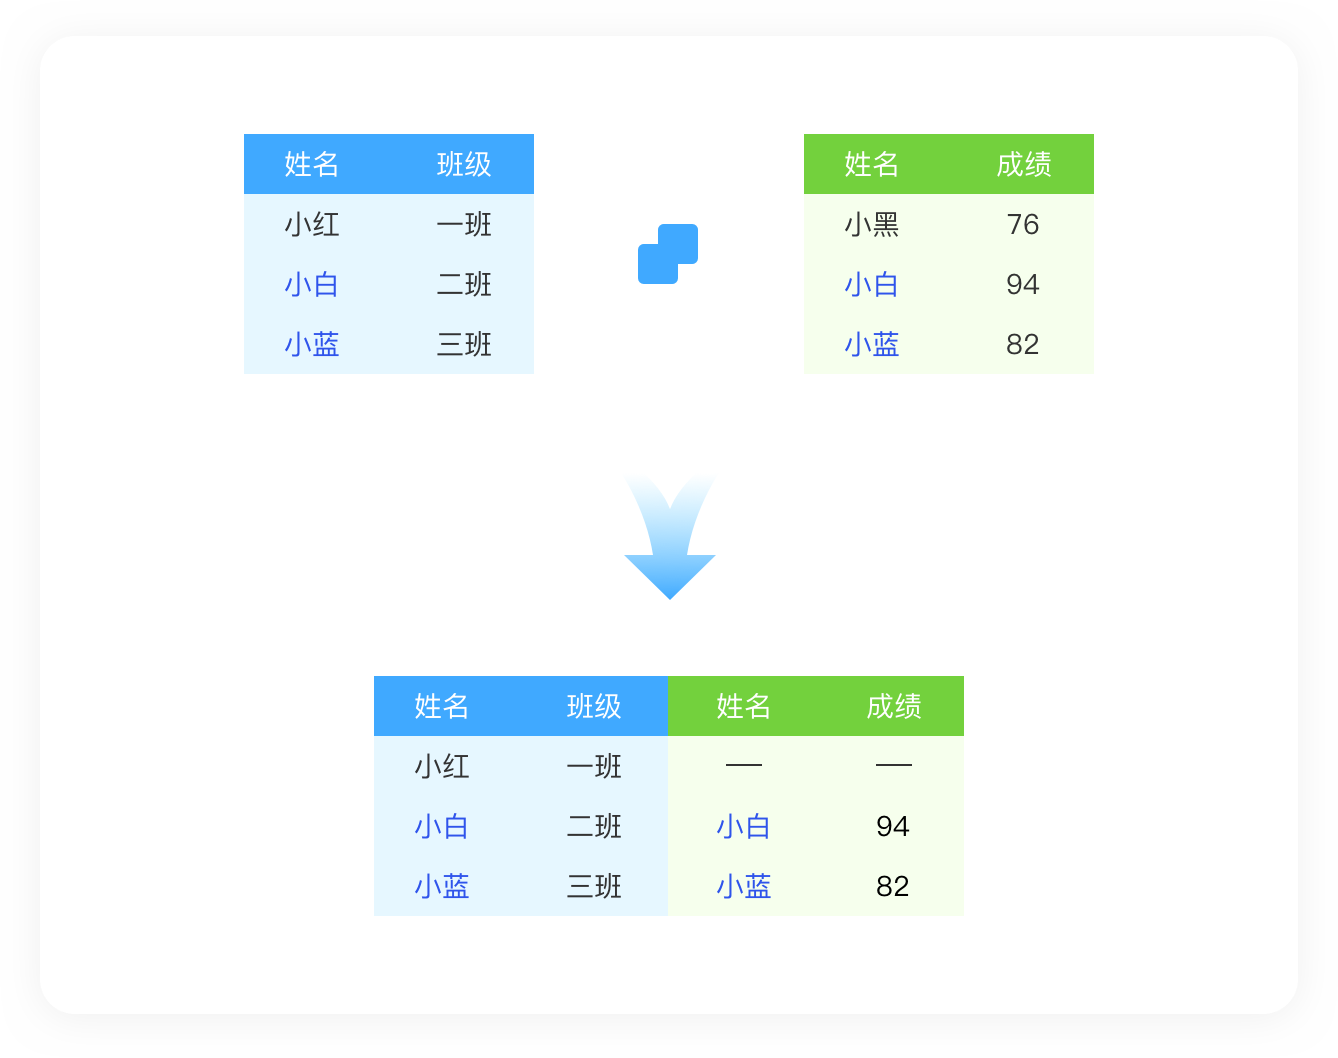
02 / Connect
Combine tables into a new data source using inner, left, or right joins.
Get Started →03 / Combine
Merge fields of the same type from multiple data tables into one column and output the result as a new data source.
Get Started →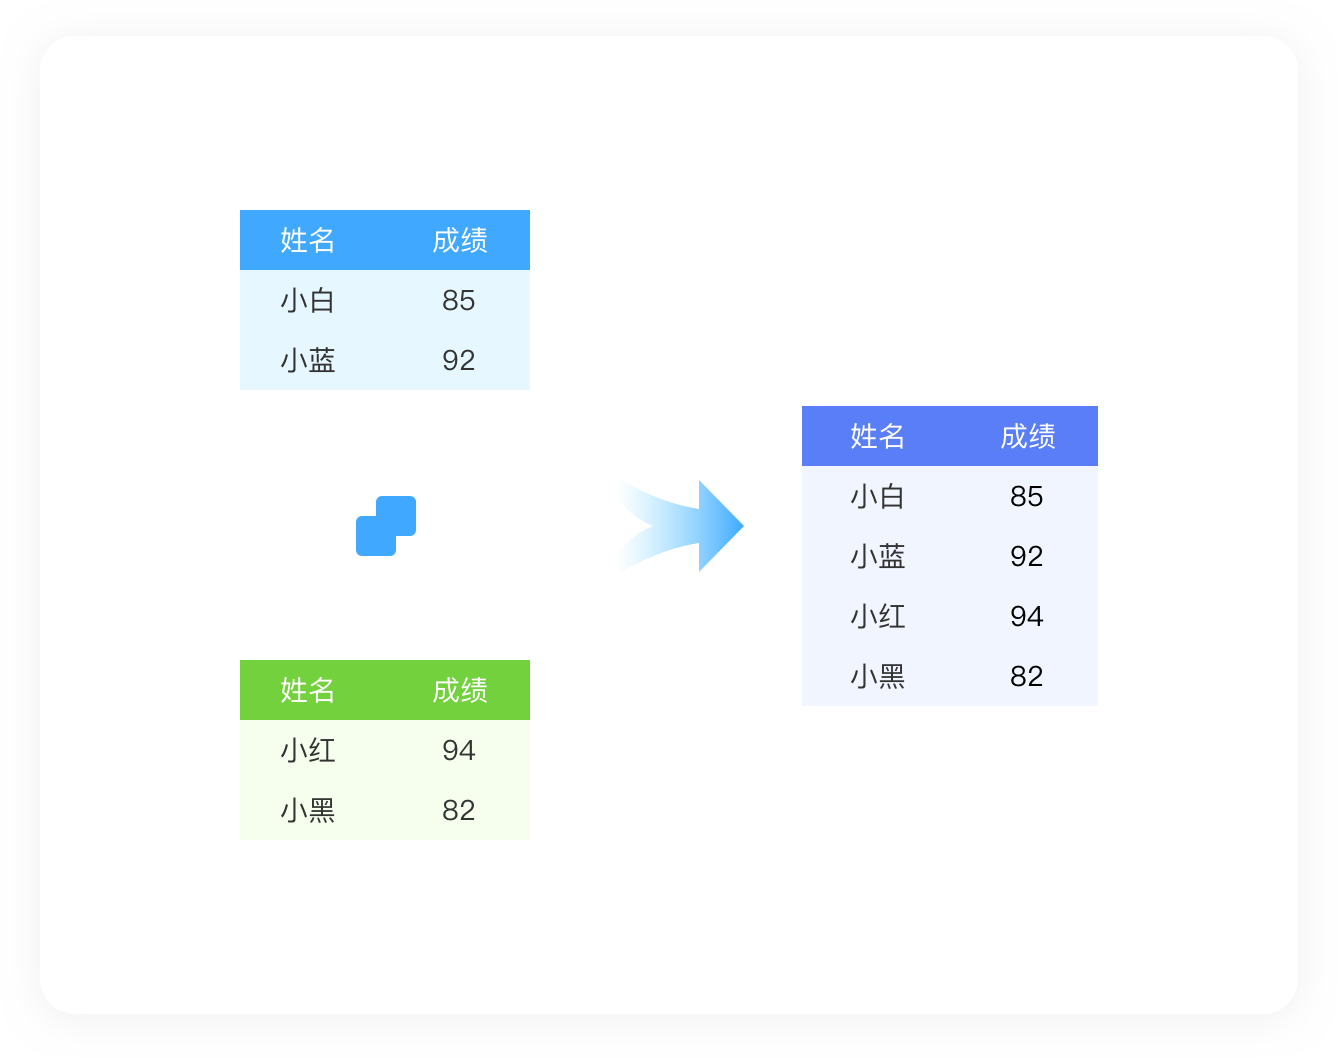
04 / Refine
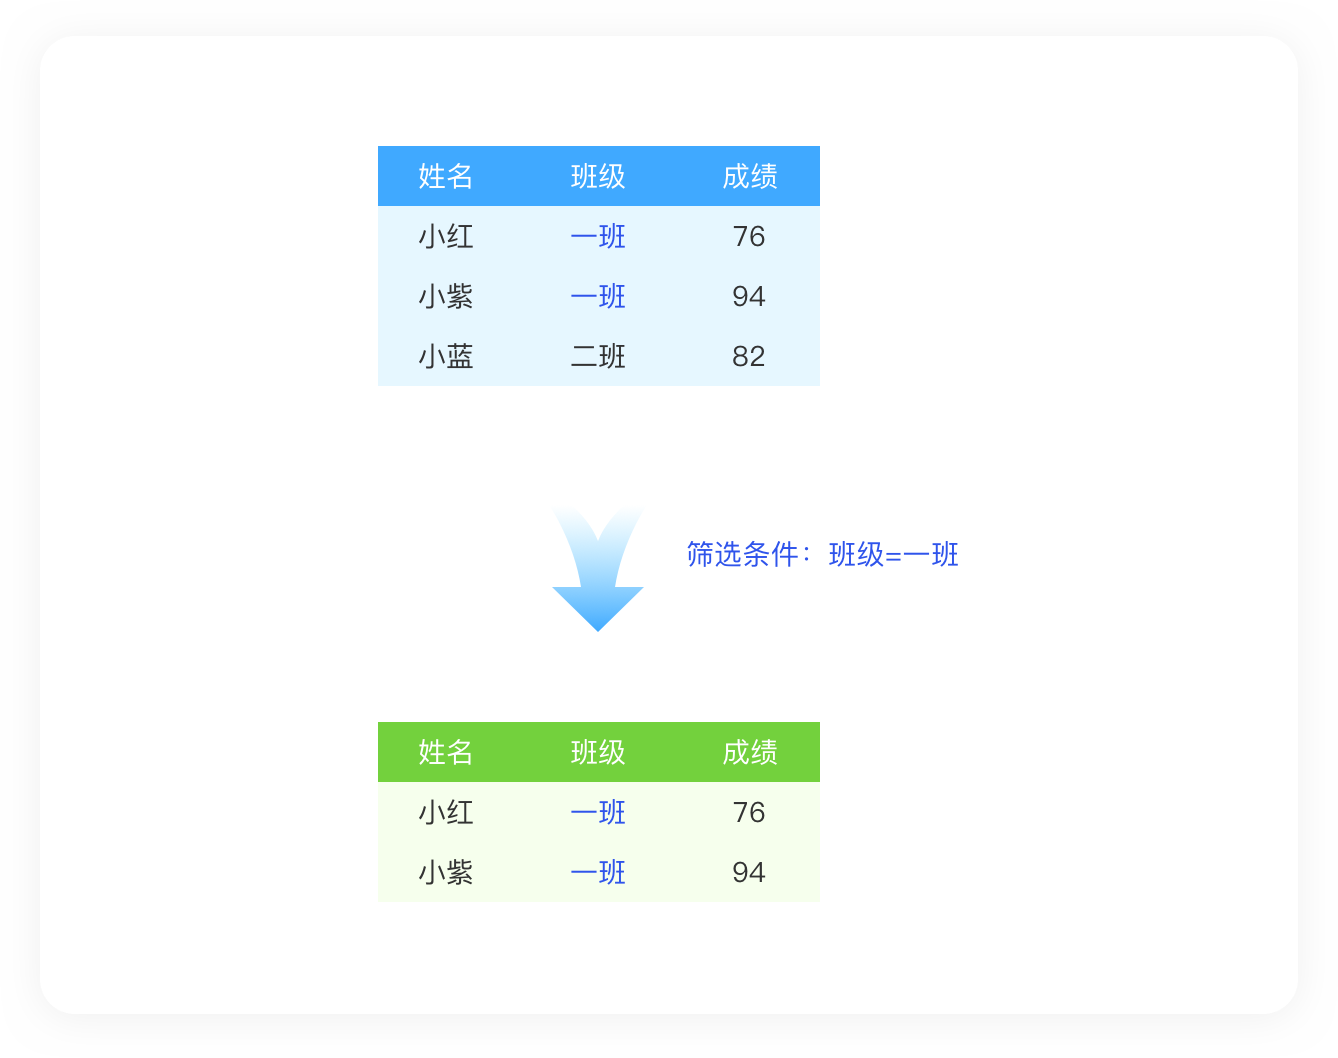
Add filter conditions to select the data needed for downstream joins, aggregation, calculations, and analysis.
Get Started →05 / Summarize
Group form data within a source and calculate useful totals and summaries.
Get Started →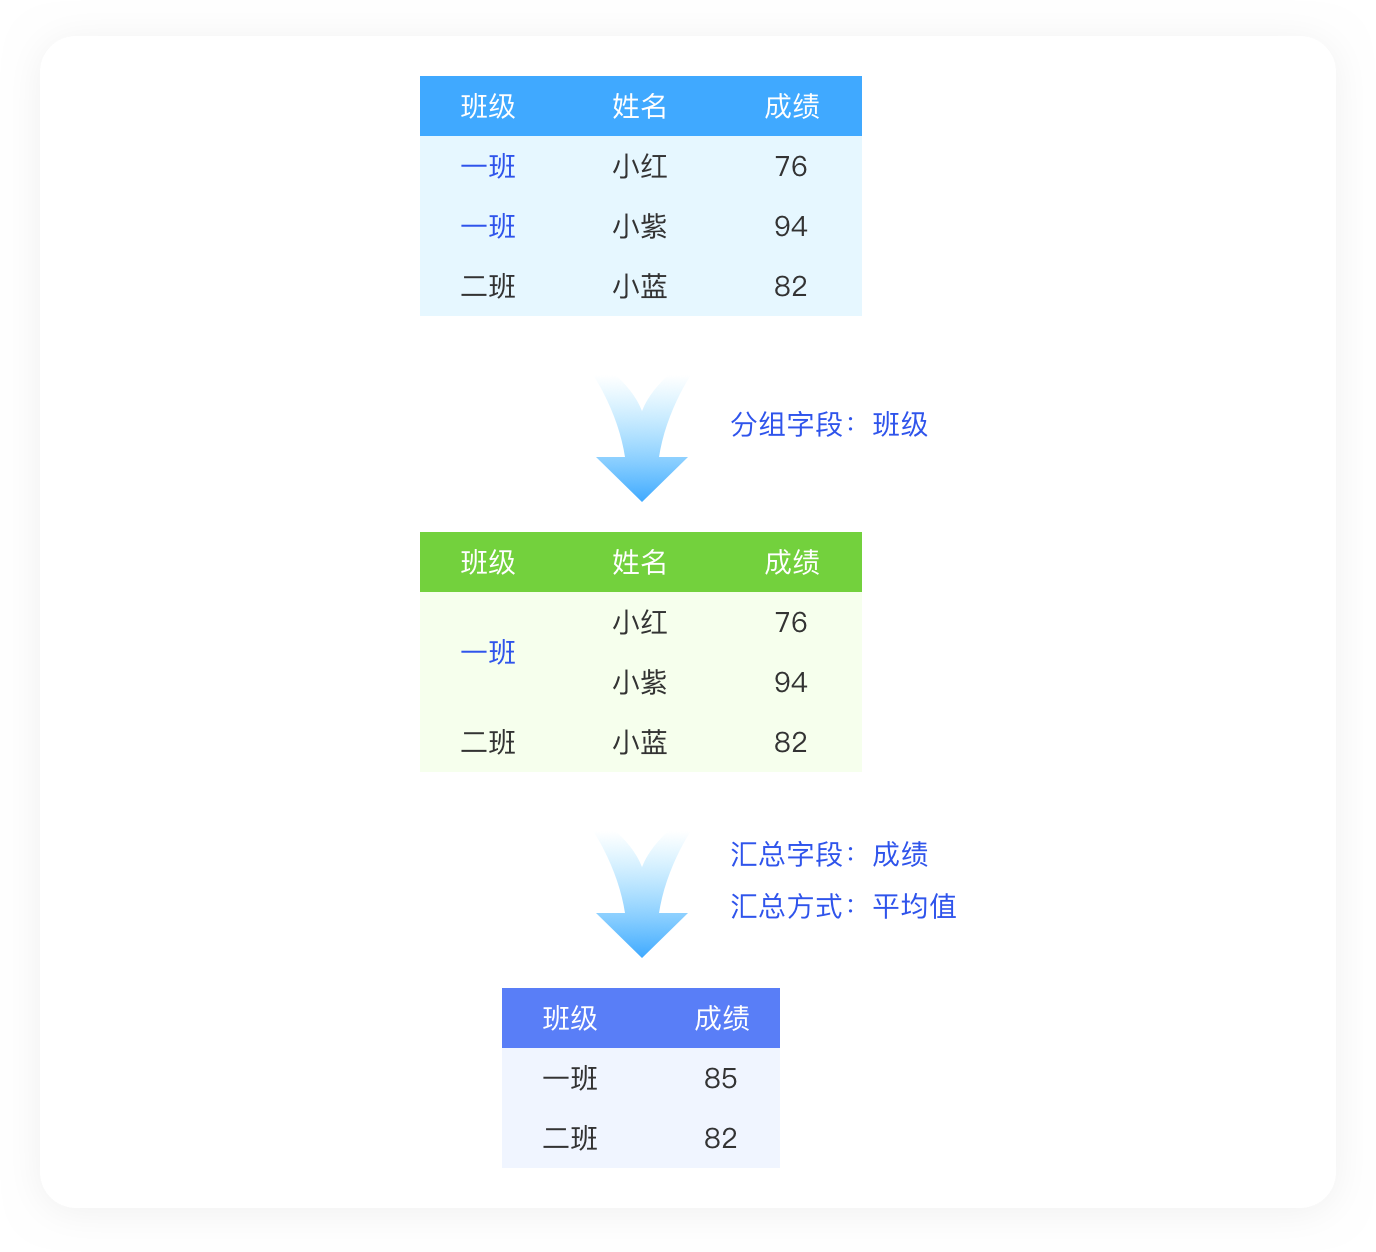
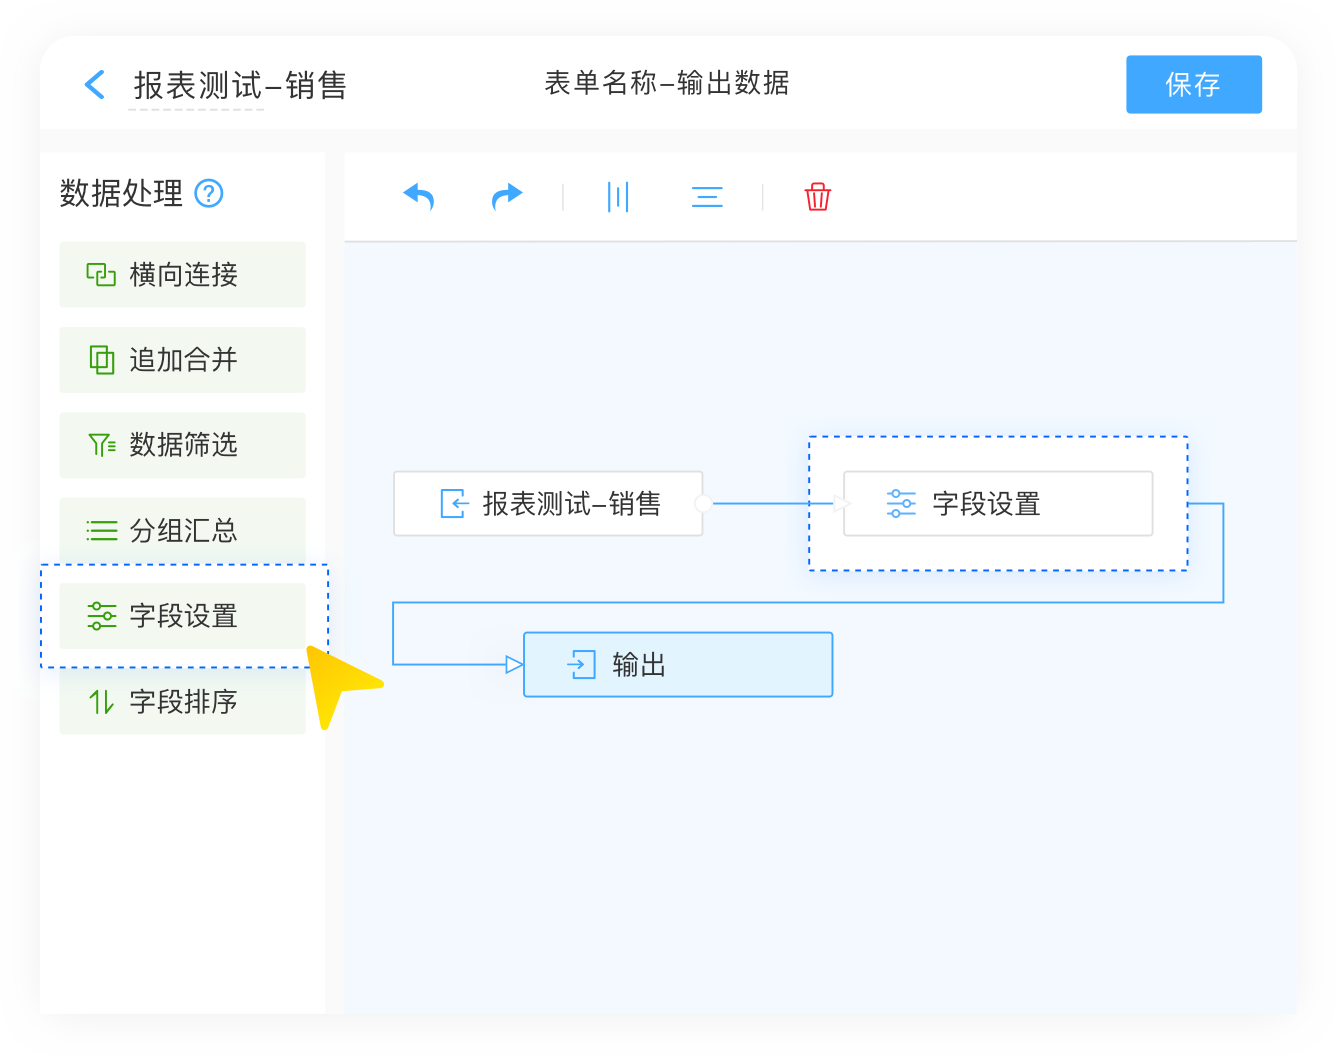
06 / Configure
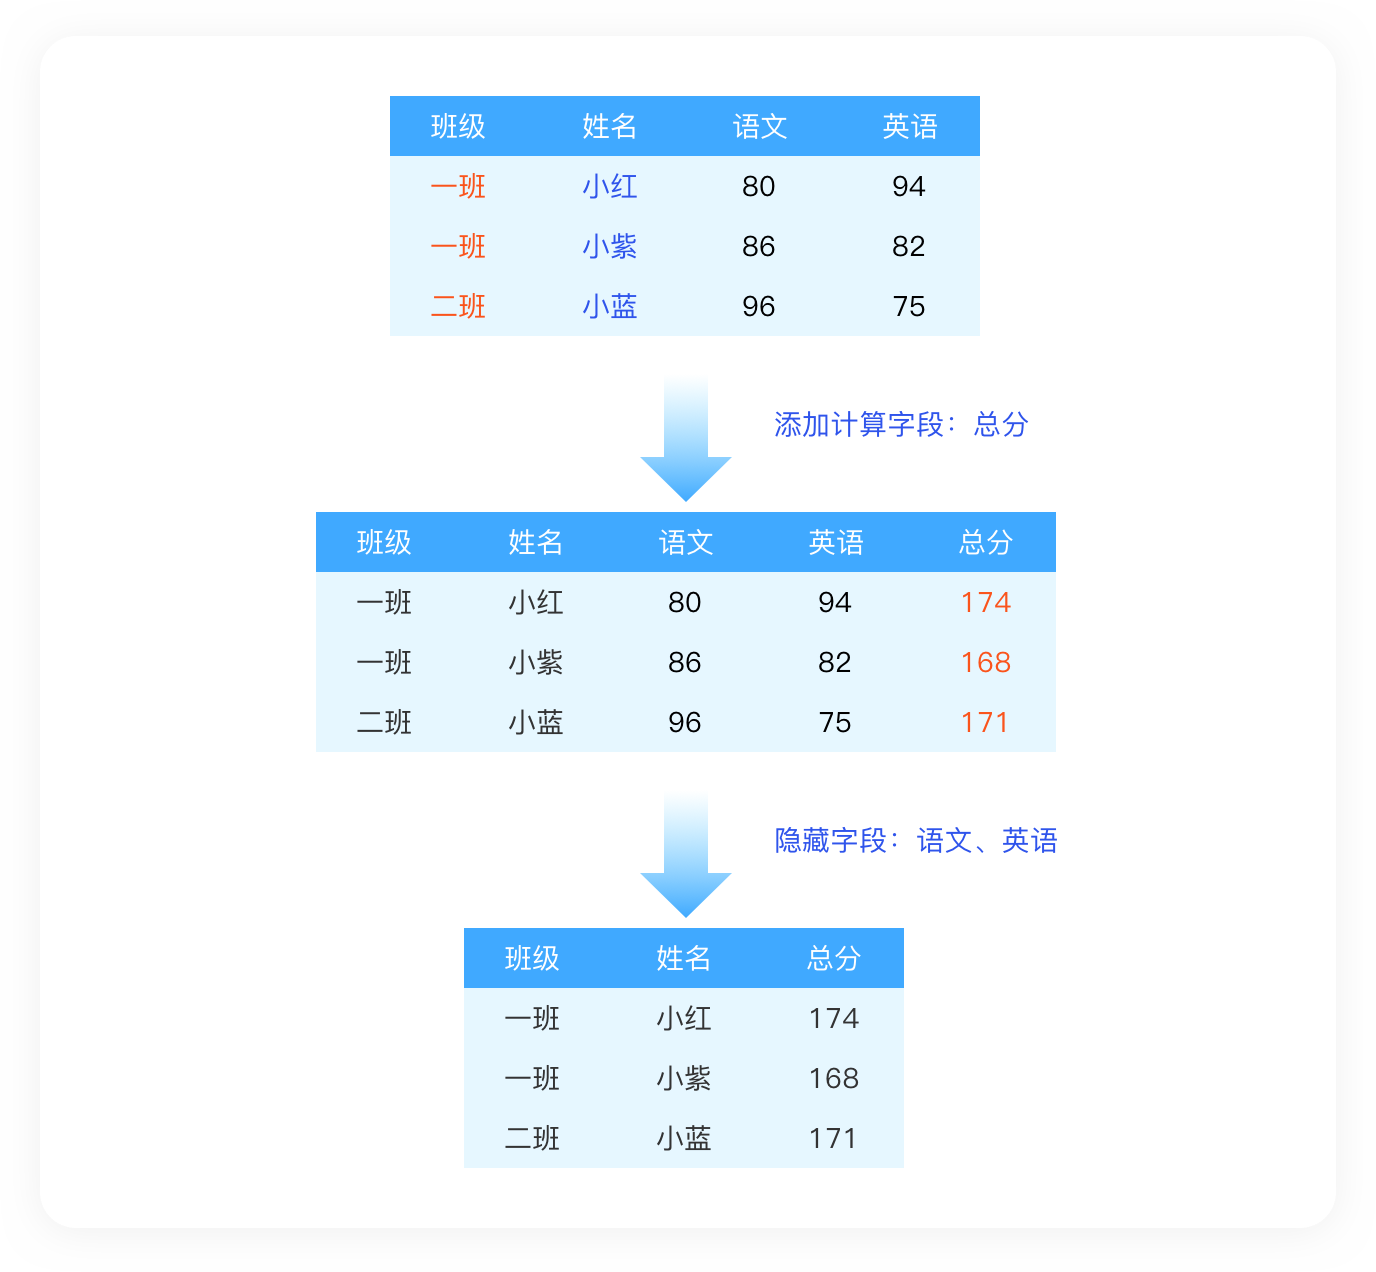
Hide or rename source-table fields and add the calculated fields your workflow requires.
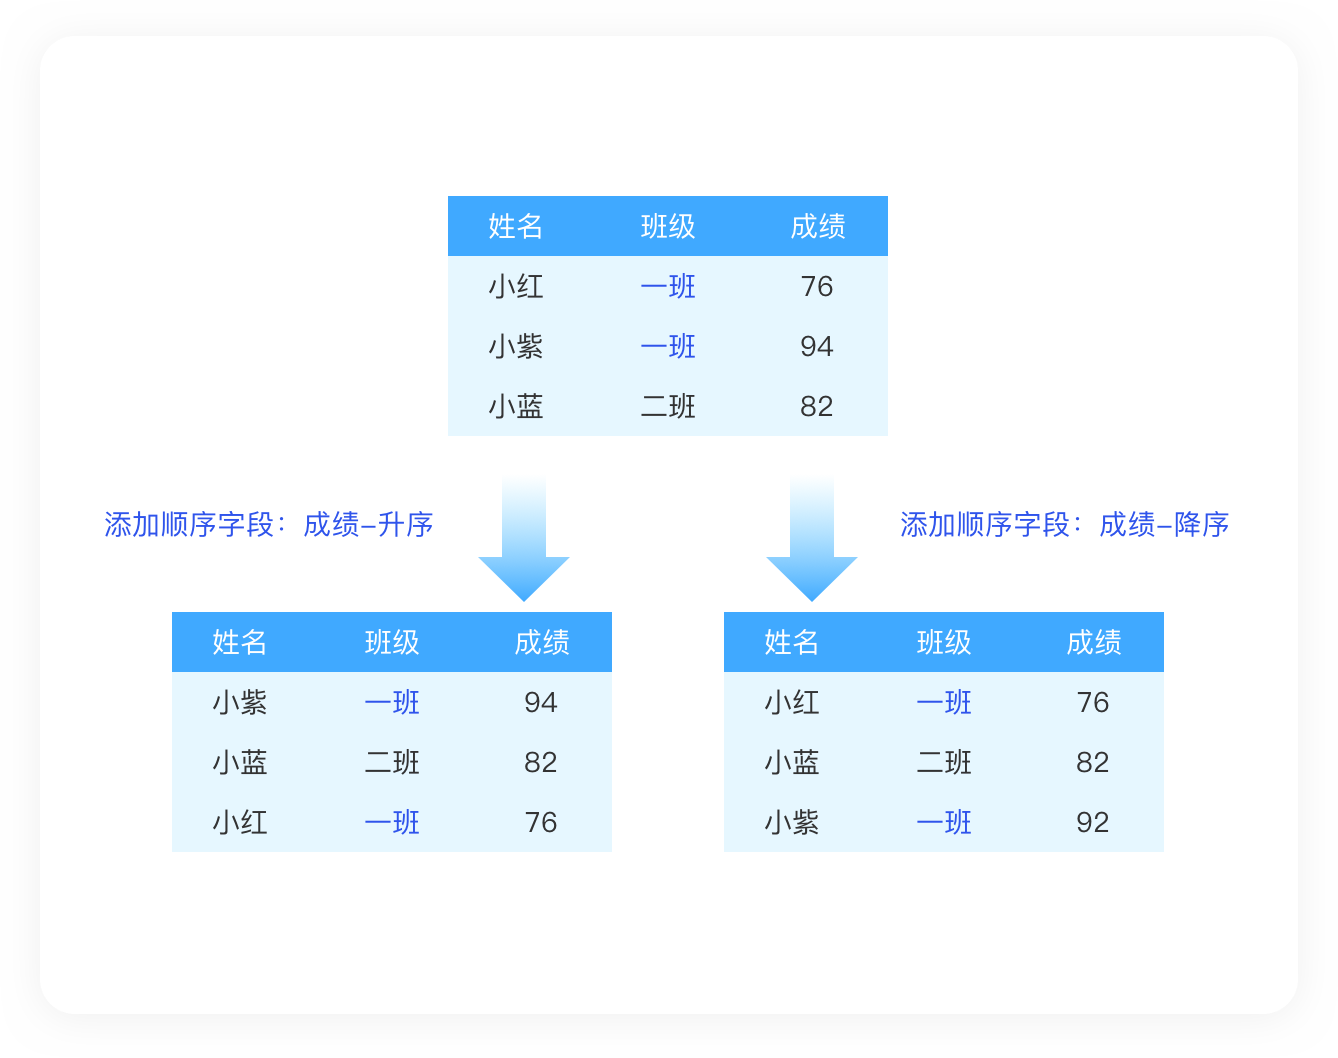
Get Started →07 / Order
Classify data by selected fields and sort values before generating aggregated results.
Get Started →